| Home | Issues & Actions | About |
Archive Page This page is available as an archive to previous versions of LandWatch websites. |
LandWatch
State of Monterey County Report 1999
3.2
Land Use Efficiency
By measuring how much land is required, per person, for urban uses, the efficiency of a community's use of land can be evaluated. The figures indicate that the Monterey County's population growth is characterized by an increasingly less efficient use of land. Between 1984 and 1996, development in Monterey County resulted in an increase in built-up urban land of 6,664 acres, a 15.6% increase. During the same period, Monterey County's population increased by 41,800 persons, a 13.1% increase. The use of land for urban purposes has been increasing faster than population growth, and each new resident is requiring more land for urban purposes than each existing resident has required in the past. For every 1,000 new residents coming to Monterey County during the 1984 to 1996 period, 159 acres of land were committed to urban uses. In 1984, only 134 acres of land were committed to urban uses for each 1000 residents (Table 4). If current trends continue, urban land uses will consume an additional 23,800 acres by the year 2020. When compared to other counties in the state, Monterey County's efficiency in the use of land is near the bottom, ranked second to Merced County, which committed 185 acres to urban uses for every 1,000 new residents. San Benito County committed 109 acres for each 1000 new residents, and Santa Cruz County committed 40. Of the counties reviewed (Table 5), only Monterey County and Merced County had a greater percent increase in urban built-up lands than in population growth. 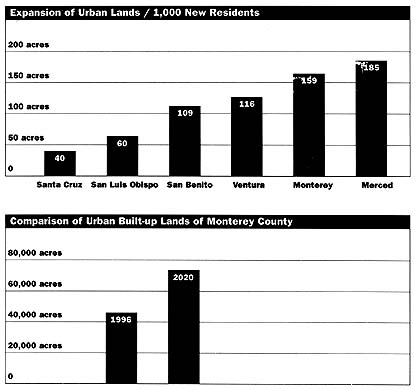
|
||||||||||||||||||||||||||||||||||||||||||||||||||||||||||||||||||||||||||||||||||||||||||||||||||||||||||||||||||||||||||||||||||||||||||||||||||||||||||||||||||||||||||||||||||||||||||||||||||||||||||

|
CONTACT 306 Capitol Street #101 PO Box 1876 Phone (831) 759-2824 Fax (831) 759-2825 |
|